
How to Fix Debugging Issues in VSCode
Published:
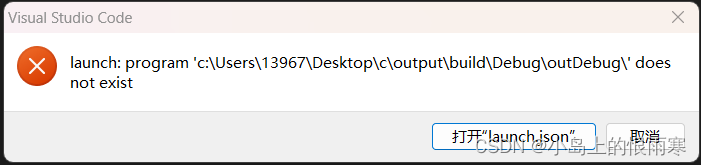
When developing code in VS Code, you may encounter the error:
launch: program 'c:\build\Debug\outDebug' does not exist
as shown in the figure below.
Following the hint, we can open the launch.json file:
{
  "version": "0.2.0",
  "configurations": [
    {
      "name": "C/C++ Runner: Debug Session",
      "type": "cppdbg",
      "request": "launch",
      "args": [],
      "stopAtEntry": false,
      "externalConsole": true,
      "cwd": "c:/Users/13967/Desktop/c/output",
      "program": "c:/Users/13967/Desktop/c/output/build/Debug/outDebug/",
      "MIMode": "gdb",
      "miDebuggerPath": "gdb",
      "setupCommands": [
        {
          "description": "Enable pretty-printing for gdb",
          "text": "-enable-pretty-printing",
          "ignoreFailures": true
        }
      ]
    }
  ]
}
After checking carefully, the issue comes from the program field:
"program": "c:/Users/13967/Desktop/c/output/build/Debug/outDebug/",
This path points to a general location, but it is not precise enough.
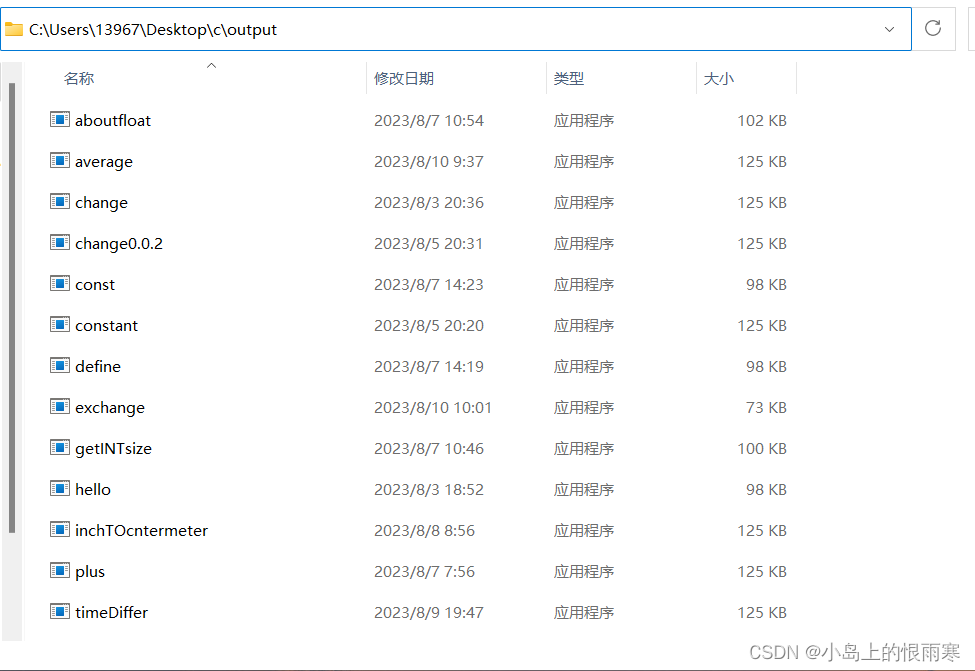
As shown, all my compiled C program executables are stored in:
C:\Users\13967\Desktop\c\output
instead of
c:/Users/13967/Desktop/c/output/build/Debug/outDebug/ defined in launch.json.
Solution
We need to set the file path to the actual folder where the compiled C executables are stored on your computer. Then append
"${fileBasenameNoExtension}.exe"
to locate the specific .exe program being debugged.
For example, on my computer, the corrected setting is:
"program": "c:/Users/13967/Desktop/c/output/${fileBasenameNoExtension}.exe"
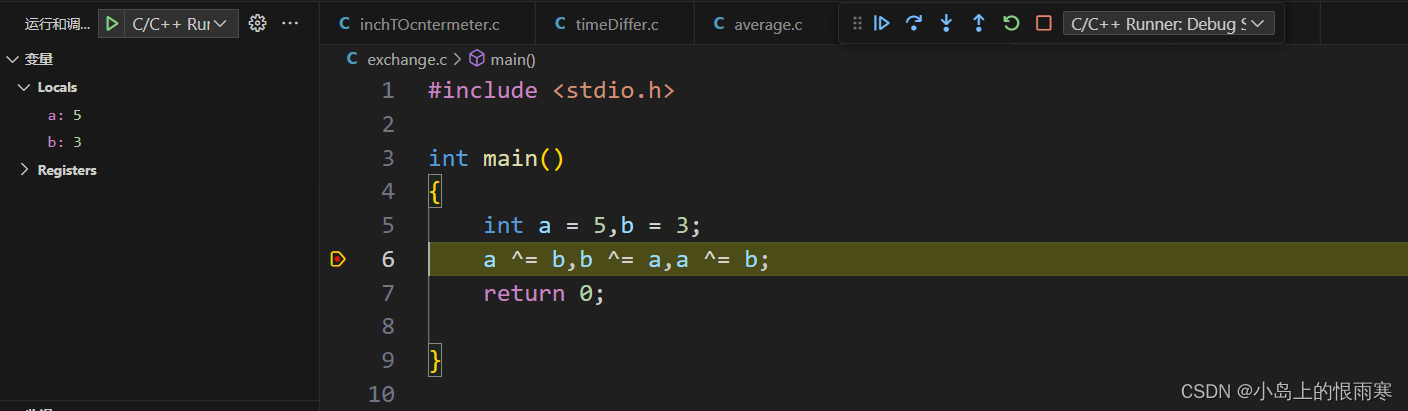
Now the problem is solved! The program can be executed, breakpoints can be set, and debugging works as expected.